
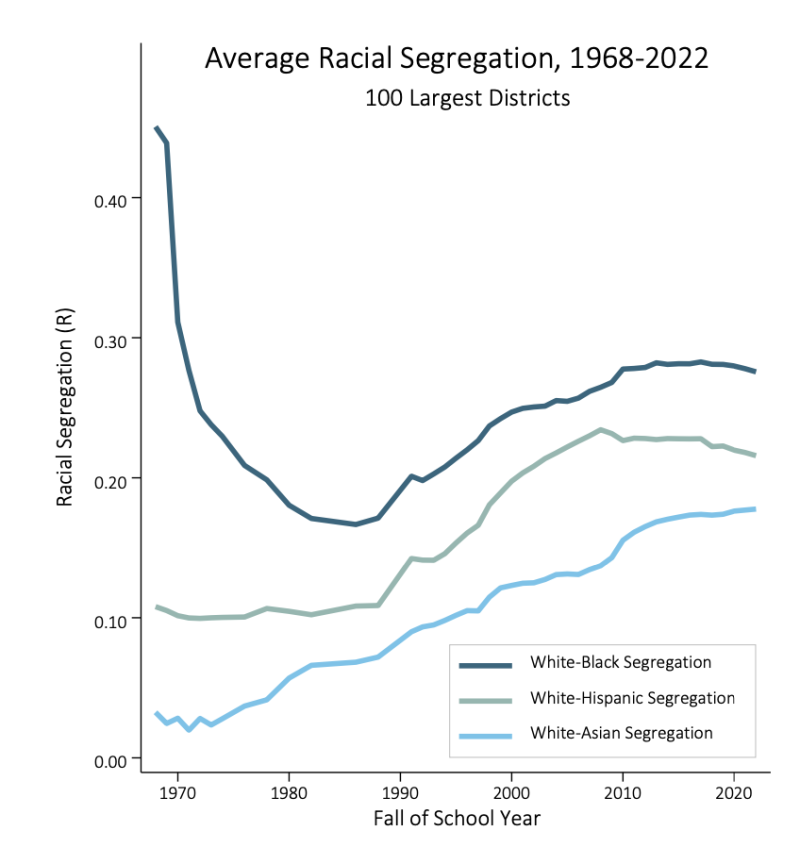
This graph above, produced by Reardon and Owens, shows how segregation plummeted across the country between 1968 and 1973. The researchers focused on roughly 500 larger school districts where there were at least 2,500 Black students. That captures nearly two-thirds of all Black students in the nation and avoids clouding the analysis with thousands of small districts of mostly white residents.
Reardon’s and Owens’s measurement of segregation compares classmates of the average white student with the classmates of the average Black student. For example, in North Carolina’s Charlotte-Mecklenberg district, the average white student in 1968 attended a school where 90% of his peers were white and only 10% were Black. The average Black student attended a school where 76% of his peers were Black and 24% were white. Reardon and Owens then calculated the gap in exposure to each race. White students had 90% white classmates while Black students had 24% white classmates. The difference was 66 percentage points. On the flip side, Black students had 76% Black classmates while white students had 10% Black classmates. Again, the difference was 66 percentage points, which translates to 0.66 on the segregation index.
But in 1973, after court-ordered desegregation went into effect, the average white student attended a school that was 69% white and 31% Black. The average Black student attended a school that was 34% Black and 66% white. In five short years, the racial exposure gap fell from 66 percentage points to 3 percentage points. Schools reflected Charlotte-Mecklenberg’s demographics. In the graph above, Reardon and Owens averaged the segregation index figures for all 533 districts with substantial Black populations. That’s what each dot represents.
In the early 1990s, this measure of segregation began to creep up again, as depicted by the red tail in the graph above. Owens calls it a “slow and steady uptick” in contrast to the drastic decline in segregation after 1968. Segregation has not bounced back or returned to pre-Brown levels. “There’s a misconception that segregation is worse than ever,” Reardon said.
Although the red line from 1990 to the present looks nearly flat, when you zoom in on it, you can see that Black-white segregation grew by 25% between 1991 and 2019. During the pandemic, segregation declined slightly again.
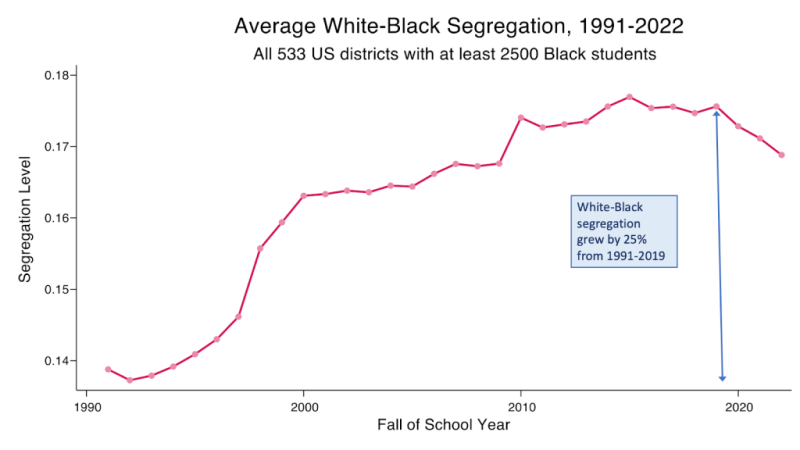
It’s important to emphasize that these Black-white segregation levels are tiny compared with the degree of segregation in the late 1960s. A 25% increase can seem like a lot, but it’s less than 4 percentage points.
“It’s big enough that it makes me worried,” said Owens. “Now is the moment to keep an eye on this. If it continues in this direction, it would take a long time to get back up to Brown. But let’s not let it keep going up.”
Even more troubling is the fact that segregation increased substantially if you zero in on the nation’s biggest cities. White-Black segregation in the largest 100 school districts increased by 64% from 1988 to 2019, Owens and Reardon calculated.
2. School choice plays a role in recent segregation
Why is segregation creeping back up again?
The expiration of court orders that mandated school integration and the expansion of school choice policies, including the rapid growth of charter schools, explains all of the increase in segregation from 2000 onward, said Reardon. Over 200 medium-sized and large districts were released from desegregation court orders from 1991 to 2009, and racial school segregation in these districts gradually increased in the years afterward.
School choice, however, appears to be the dominant force. More than half of the increase in segregation in the 2000s can be attributed to the rise of charter schools, whose numbers began to increase rapidly in the late 1990s. In many cases, either white or Black families flocked to different charter schools, leaving behind a less diverse student body in traditional public schools.
The reason for the rise in segregation in the 1990s before the number of charter schools soared is harder to understand. Owens speculates that other school choice policies, such as the option to attend any public school within a district or the creation of new magnet schools, may have played a role, but she doesn’t have the data to prove that. White gentrification of cities in the 1990s could also be a factor, she said, as the white newcomers favored a small set of schools or sent their children to private schools.
“We might just be catching a moment where there’s been an influx of one group before the other group leaves,” said Owens. “It’s hard to say how the numbers will look 10 years from now.”
3. It’s important to disentangle demographic shifts from segregation increases
There’s a popular narrative that segregation has increased because Black students are more likely to attend school with other students who are not white, especially Hispanic students. But Reardon and Owens say this analysis conflates demographic shifts in the U.S. population with segregation. The share of Hispanic students in U.S. schools now approaches30% and everyone is attending schools with more Hispanic classmates. White students, who used to represent85% of the U.S. student population in 1970, now make up less than half.

The blue line in the graph above shows how the classmates of the average Black, Hispanic or Native American student have increased from about 55% Black, Hispanic and Native American students in the early 1970s to nearly 80% Black, Hispanic and Native American students today. That means that the average student who is not white is attending a school that is overwhelmingly made up of students who are not white.
But look at how the red line, which depicts white students, is following the same path. The average white student is attending a school that moved from 35% students who are not white in the 1970s to nearly 70% students who are not white today. “It’s entirely driven by Hispanic students,” said Owens. “Even the ‘white’ schools in L.A. are 40% Hispanic.”
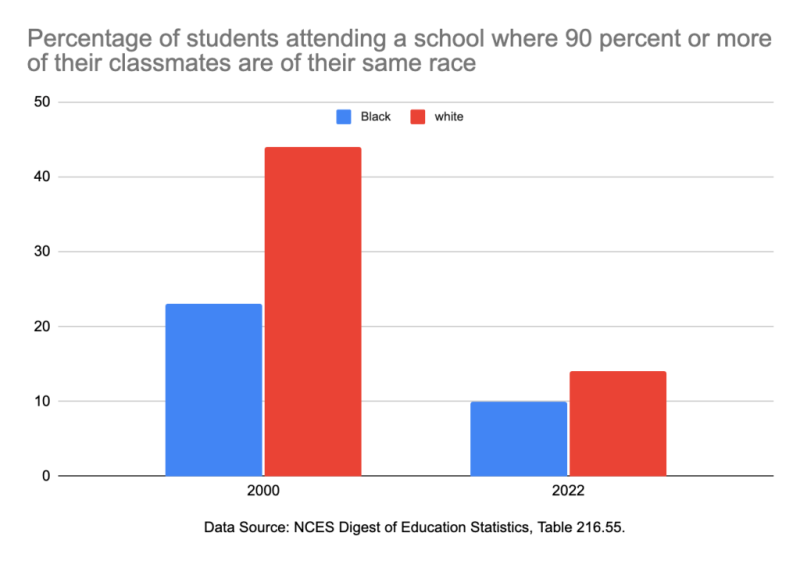
I dug into U.S. Department of Education data to show how extremely segregated schools have become less common. The percentage of Black students attending a school that is 90% or more Black fell from 23% in 2000 to 10% in 2022. Only 1 in 10 Black students attends an all-Black or a nearly all-Black school. Meanwhile, the percentage of white students attending a school that is 90% or more white fell from 44% to 14% during this same time period. That’s 1 in 7. Far fewer Black or white students are learning in schools that are almost entirely made up of students of their same race.
At the same time, the percentage of Black students attending a school where 90% of students are not white grew from 37% in 2000 to 40% in 2022. But notice the sharp growth of Hispanic students during this period. They went from 7.6 million (fewer than the number of Black students) to more than 13.9 million (almost double the number of Black students).
4. Most segregation falls across school district boundaries
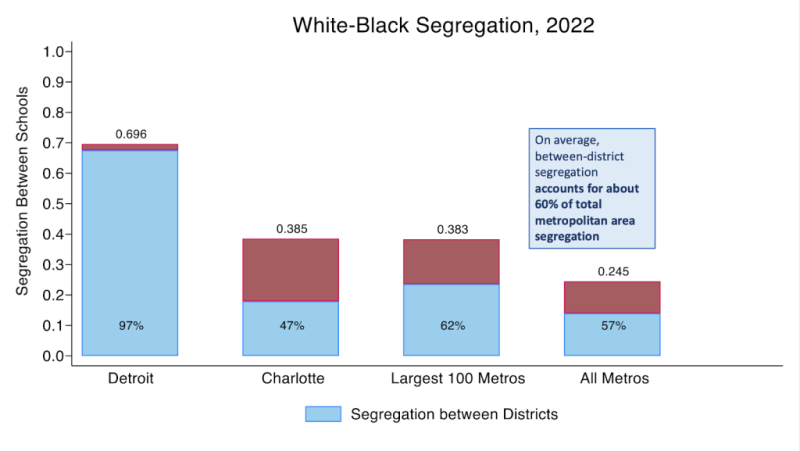
This bar chart shows how schools are segregated for two reasons. One is that people of different races live on opposite sides of school district lines. Detroit is an extreme example. The city schools are dominated by Black students. Meanwhile, the Detroit suburbs, which operate independent school systems, are dominated by white students. Almost all the segregation is because people of different races live in different districts. Meanwhile, in the Charlotte, North Carolina, metropolitan area, over half of the segregation reflects the uneven distribution of students within school districts.
Nationally, 60% of the segregation occurs because of the Detroit scenario: People live across administrative borders, Reardon and Owens calculated. Still, 40% of current segregation is within administrative borders that policymakers can control.
5. Residential segregation is decreasing
People often say there’s little that can be done about school segregation until we integrate neighborhoods. I was surprised to learn that residential segregation has been declining over the past 30 years, according to Reardon’s and Owens’s analysis of census tracts. More Black and white people live in proximity to each other. And yet, at the same time, school segregation is getting worse.
All this matters, Reardon said, because kids are learning at different rates in more segregated systems. “We know that more integrated schools provide more equal educational opportunities,” he said. “The things we’re doing with our school systems are making segregation worse.”
Reardon recommends more reforms to housing policy to integrate neighborhoods and more “guard rails” on school choice systems so that they cannot be allowed to produce highly segregated schools.


