Are Stocks Going to Crash if Joe Biden Wins and Democrats Control Congress? Here’s What History Says About Stock Market Returns When Democrats Win.

In just a little over six months, Americans from across the nation will head to the polls or mail in their ballots to determine who’ll lead our great country for the next four years.
While there are numerous aspects to the presidency, and lawmaking in general, that have nothing to do with Wall Street and investing, changes to fiscal policy, which are typically drafted by Congress and signed into law by the president, do impact the health of the U.S. economy and the bottom line for corporate America.
As of the closing bell on April 24, incumbent Joe Biden had earned 3,237 delegates during presidential primaries. That’s well beyond the 1,968 delegates needed to secure the presumptive nomination for president from the Democratic Party. Since taking office on Jan. 20, 2021, Biden has overseen gains of 23% in the iconic Dow Jones Industrial Average (DJINDICES: ^DJI), 32% in the benchmark S&P 500 (SNPINDEX: ^GSPC), and 17% in the growth-driven Nasdaq Composite (NASDAQINDEX: ^IXIC).
Similar to his predecessor, Donald Trump, Biden worked with a unified Congress that was controlled by his party during his first two years in the Oval Office, and a split Congress in the second-half of his presidency (Republicans took control of the House of Representatives on Jan.3, 2023).

But could a second term for Joe Biden, coupled with Democrats taking control of both houses of Congress, set stocks up for a mammoth crash? Let’s dig into the challenges Biden and a Democratic Congress would face and let history be the ultimate judge of things.
Are stocks going to crash if Joe Biden wins in November and Democrats control Congress?
Although it’s impossible to predict precisely when a big downturn will occur in the stock market, the impetus for a “crash” would likely boil down to certain policy proposals from Biden and his colleagues, as well as select economic headwinds, which could be troublesome regardless of who is elected as president come November.
Two policy proposals, in particular, could give Wall Street and investors reason to head for proverbial hills. To start with, President Biden noted during his State of the Union address in March that he wants to quadruple the share buyback tax to 4%. Companies buying back their own stock have helped lift their earnings per share (EPS), which in turn has played a key role in expanding valuations. Quadrupling the existing buyback tax would make share repurchases less attractive and adversely impact earnings multiples at a time when stocks are quite pricey.
The other proposal that could knock the Dow, S&P 500, and Nasdaq Composite off of their respective pedestals is increasing the peak marginal corporate tax rate to 28% from 21%, as well as the corporate alternative minimum tax rate from 15% to 21%. Not only would businesses be discouraged from buying back their stock, but they’d have less disposable income to work with if corporate tax rates rise.
But as noted, Democratic Party policy proposals aren’t the only concern. There are two economic headwinds that could spell trouble for Wall Street regardless of whether Biden or Trump wins in November.
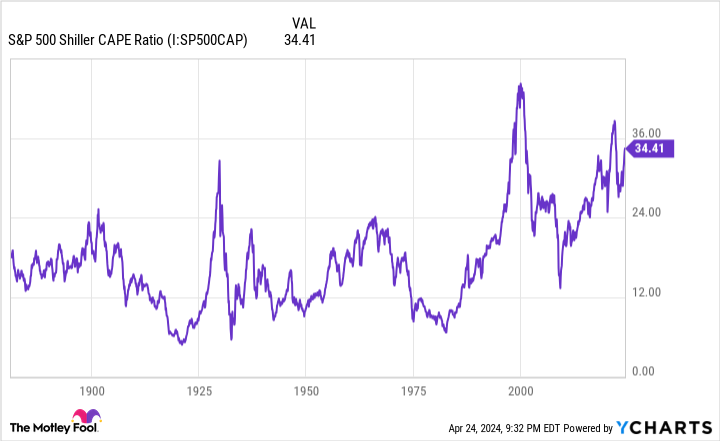
The first issue is that stocks are historically pricey. As of the closing bell on April 24, the S&P 500’s Shiller price-to-earnings (P/E) ratio (also known as the cyclically adjusted price-to-earnings ratio, or CAPE ratio) was well above its historic norm.
Whereas the traditional P/E ratio divides a company’s share price into its trailing-12-month EPS, the Shiller P/E is based on average inflation-adjusted earnings from the last 10 years. Removing single-year hiccups that could skew the P/E ratio makes the Shiller P/E a potentially more attractive valuation tool over the long run.
On April 24, the S&P 500’s Shiller P/E stood at 33.67, which is nearly double the 17.11 it’s averaged when back-tested to 1871.
The bigger worry is there have only been six total instances in 153 years where the Shiller P/E has surpassed 30 during a bull market. Following the previous five instances, the S&P 500 or Dow Jones Industrial Average went on to lose 20% to 89% of their respective value. Anytime valuations become extended, it eventually results in a big pullback for stocks.
WARNING: the Money Supply is officially contracting. 📉
This has only happened 4 previous times in last 150 years.
Each time a Depression with double-digit unemployment rates followed. 😬 pic.twitter.com/j3FE532oac
— Nick Gerli (@nickgerli1) March 8, 2023
The other catalyst for a potential crash in stocks is the historic decline in U.S. M2 money supply. M2 money supply accounts for everything in M1 — cash and coins in circulation, along with demand deposits in a checking account — and adds in savings accounts, money market accounts, and certificates of deposit (CDs) below $100,000.
There’s normally little reason to pay much attention to M2 because the U.S. economy expands with such consistency over long periods. But after peaking in March 2022, M2 money supply has declined by nearly 4.4%. It’s the first time we’ve witnessed a year-over-year decline in M2 of at least 2% since the Great Depression.
Based on data compiled last year by Reventure Consulting CEO Nick Gerli, there have only been five instances since 1870 where M2 fell by at least 2% from the previous year. The four previous times (1878, 1893, 1921, and 1931-1933) all coincided with deflationary depressions and high unemployment.
The caveat to the above is that M2 money supply expanded at its fastest rate ever during the COVID-19 pandemic. The decline we’re seeing now could just be a simple reversion to the mean. Nevertheless, having less capital available for transactions has historically been a recipe for a U.S. recession.
This combination of policy proposals and economic headwinds could spell trouble for stocks if Democrats control Congress and the White House.
Here’s what history says happens when Democrats have a unified government
With a better understanding of the potential challenges that would await if President Biden wins in November and Democrats take control of Congress, let’s take a closer look at what history has to say.
Based on a study conducted by CFRA Research, there isn’t a political scenario that’s produced a negative average annual return dating back to 1945. No matter how the puzzle pieces are arranged, patient investors have always come out as winners.
According to CFRA Research, there were 23 years between Dec. 31, 1944 and Dec. 31, 2021 where Democrats controlled Congress and the White House. In those 23 years, the benchmark S&P 500 averaged a 10.5% return. While this is a bit below the 12.9% average annual return under a Republican unified government, it’s still an above-average return.
Retirement Researcher took things one step further and examined the average annual return of the S&P 500 from 1926 through 2023 using various political situations. The 36 years of a unified government under Democrats in this nearly one-century timeline resulted in an average annual return of 14.01%!
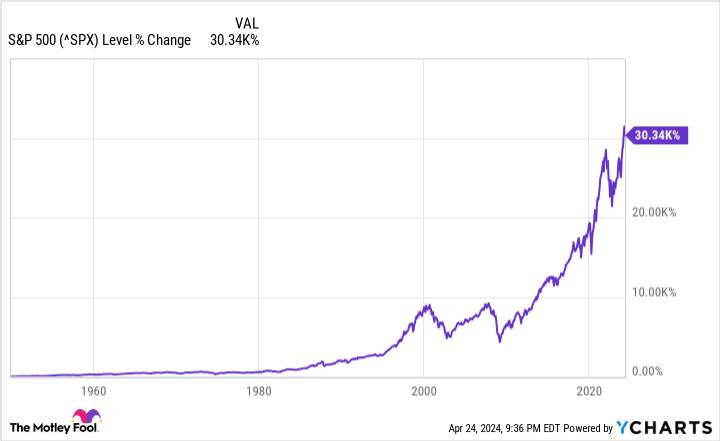
The point here is simple: the stock market tends to deliver for patient shareholders over the long run regardless of which political party is in control.
The reason stocks have outperformed all other asset classes over the last century is because they benefit from long-winded economic expansions.
On one hand, recessions are an inevitable part of the economic cycle. Since the end of World War II, the U.S. economy has navigated its way through a dozen downturns. But did you know that nine of these recessions resolved in less than a year, while none of the remaining three lasted longer than 18 months?
On the other side of the coin, periods of economic growth often stick around for multiple years. Two of the expansions since World War II lasted longer than 10 years. It’s these lengthy expansions that allow corporate profits to really grow.
Perhaps the most-compelling data set on the power of patience and perspective was offered by the analysts at Bespoke Investment Group.
Last June, Bespoke calculated the length of every bull and bear market in the S&P 500 dating back to the start of the Great Depression in September 1929. The data showed that while the average S&P 500 bear market lasted 286 calendar days, the typical bull market spanning 94 years stuck around for 1,011 calendar days, or about 3.5 times as long.
Furthermore, there have been 13 bull markets in the S&P 500 since September 1929 that have lasted longer than the lengthiest bear market in the broad-based index.
Patience and perspective have a way of rewarding investors, regardless of which political party is in power. If Joe Biden wins in November and Democrats control Congress, investors with a long-term mindset should fare well.
Where to invest $1,000 right now
When our analyst team has a stock tip, it can pay to listen. After all, the newsletter they have run for over a decade, Motley Fool Stock Advisor, has nearly tripled the market.*
They just revealed what they believe are the 10 best stocks for investors to buy right now…
*Stock Advisor returns as of April 22, 2024
Sean Williams has no position in any of the stocks mentioned. The Motley Fool has no position in any of the stocks mentioned. The Motley Fool has a disclosure policy.
Are Stocks Going to Crash if Joe Biden Wins and Democrats Control Congress? Here’s What History Says About Stock Market Returns When Democrats Win. was originally published by The Motley Fool


