
The complacency about absenteeism may have to do with the attendance data that school leaders see everyday, which is typically a list of absent students. Each day, this can seem like a reasonable number – perhaps 30 students in a school of 300. And yet alarmingly high absenteeism rates can lurk beneath attendance rates that seem fine.
“Ninety percent sounds like good attendance, but it is not,” said Nat Malkus, a senior fellow at the American Enterprise Institute, a conservative think tank, who has been studying the post-pandemic surge in absenteeism.
Malkus showed me spreadsheets of 2022-23 attendance data from three states: Illinois, Ohio and Florida. In the districts where 90% of the students showed up every day, the chronic absenteeism rate ranged from 28% to 46%. Think about this. There are many schools where an overwhelming majority of students are present on any given day, but more than two out of five students are still missing big chunks of the school year.
Here’s a more current example from a middle school in Nashville, Tennessee. Its principal told me that his average daily attendance rate is currently 93.5%, an improvement from last year. But as of February 2024, chronic absenteeism is already 22.9% – more than one in five students.
How can this be? At first glance it seems the combination of high attendance and high absenteeism is a paradox.
Dave Moyer, an education data analyst in Portland, Oregon, who has been studying absenteeism for more than a decade, helped me solve the puzzle.
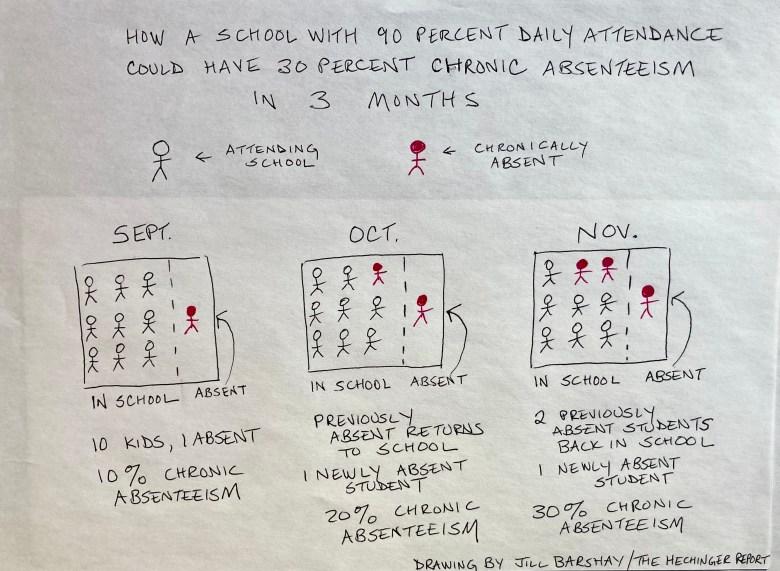
Consider a school with 90% attendance and 100 students. Imagine that in September, 90 kids have perfect attendance and the same 10 kids are absent for the entire month. Already 10% of the students have missed more than 18 school days, crossing the threshold of chronic absenteeism.
Say their parents lure them back to the classroom and a different group of 10 students is absent for all of October. The chronic absenteeism rate doubles to 20%. In November, the October absentees return to school and a fresh group of 10 kids play hooky: chronic absenteeism jumps to 30%.
If this extreme pattern continues, where a fresh group of 10 kids stops attending each month, you’ll reach 40% chronic absenteeism halfway through the year. In theory, the chronic absenteeism rate could grow to 90% during a nine-month school year, equaling the 90% daily attendance rate.
Of course, most chronically absent kids aren’t missing for a whole month at once, and those who are out for weeks at a time tend not to have perfect attendance when they return. But this stylized example of a rotating cast of absent students helps explain why chronic absenteeism isn’t simply the opposite of attendance. Chronic absenteeism isn’t just 10% when attendance rates are 90%. It’s a lot higher.
Chronic absenteeism manifests itself in different patterns, Moyer said. Some kids will be out for a week or two in a row, and school leaders know who those kids are. Others miss three or four days every month. Those absences add up, eventually crossing the chronically absent threshold after several months, but they’re not as obvious.
It’s unclear how many principals are able to monitor their chronic absenteeism data on a regular basis. The state of Rhode Island recently built a public data dashboard to track chronic absenteeism at every school, and it’s updated daily. Connecticut updates its absenteeism dashboard monthly.
For schools, it’s trickier to keep track of chronic absenteeism than it is to take attendance. It’s like remembering how many days each of your children has forgotten to do the dishes during the year.
Schools generally don’t calculate chronic absenteeism in house. Typically, schools upload their attendance rolls to the district, and a computer in a back office does it. Sometimes chronic absenteeism calculations are conducted only once at the end of the year, for required state reporting to the Department of Education, which began collecting data on chronic absenteeism in 2015. By the time this data filters back down to school leaders, if it does filter down, it is old information and it’s too late for school leaders to do much about it.
Kevin Armstrong, the principal of the Nashville middle school mentioned above, read aloud his high chronic absenteeism figures from a computer dashboard purchased by his school district. He counts himself among the minority of principals who are extremely concerned about these numbers. His eighth graders, he said, have the highest rates: already 29% of them are chronically absent. But not all principals across the country have access to current attendance data like Armstrong does.
Armstrong said he’s put a team of teachers and staff on the problem. They are calling parents to find out why students aren’t coming. Chronic absenteeism has improved since last year, but it’s still much higher than before the pandemic. And it’s hard, as a school leader, to be judged by a metric that schools can’t control. “I’m not the alarm clock,” he said. “We need to have parents at the table to figure out why they’re allowing their kids to miss 30, 40, 50 days of school.”
“I’m frustrated,” he said. “We just want our kids to be here.”